Dashboard Screen Layout
Dashboards display on the BST11 content pane. Dashboards contain both real-time and historically accessed, dynamically updated data through a collection of visualizers about a management area in the system.
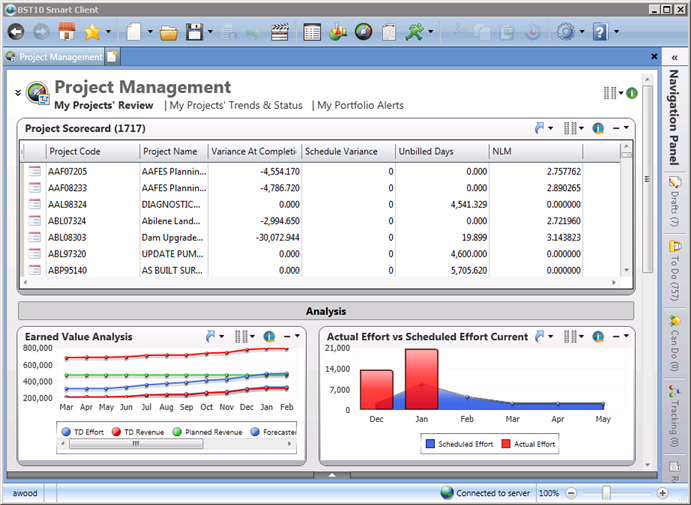
Each dashboard will have a different layout made up of various visualizers, but the following elements are generally included on each dashboard. For information on how to customize a dashboard, see Personalize a Dashboard.
At the top of the dashboard, the dashboard name and related icon are displayed. If the dashboard contains multiple tabs of information, linked tabs are displayed just beneath the dashboard name. In addition, to the left of the dashboard name, each dashboard has a collapsed restrictions area, which allows you to filter data. It depends on the data in a dashboard whether restrictions will affect the data in each visualizer. For information on the general Content Pane controls such as the Related Items, Views, and Information buttons, see Content Pane Overview.
Zones are used to break dashboards down into sections of data and contain a grouping of one or more visualizers. Each zone is denoted by a bar with a heading title.
Each dashboard includes a series of visualizers that contain specific information on an area of data in the system. Visualizers can be in different formats such as charts and lists. In addition, some visualizers contain multiple views, which allow you to view different sets of data or view the current data in a different format. For more information, see Views, Chart Views and How to Work with Lists.